
Why a Deployment Returns 502 Bad Gateway
Trace a failed proxy-to-app connection through process startup, port binding, health, timeouts, and logs.
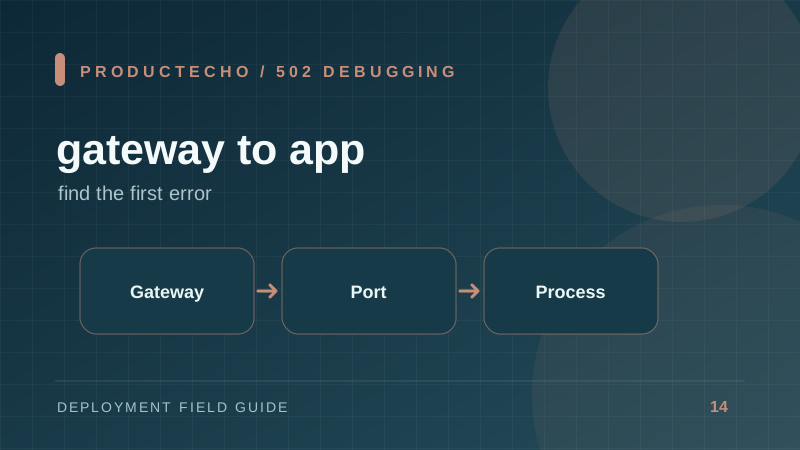
What a 502 actually tells you
HTTP 502 means a gateway received an invalid response from an upstream server. In an app deployment, the gateway is often a reverse proxy or load balancer and the upstream is your process. This narrows the search: the browser reached an edge, but the edge could not complete a valid exchange with the app.
Begin with a timestamp and one failing URL. Compare the proxy error at that time with application logs. A deployment may have built successfully and still fail because the process exited, listened on the wrong port, timed out, or closed a connection before responding.
Diagnose by where the request stopped
- No process: inspect the first startup exception. Common causes are missing runtime variables, import failures, a failed migration, or out-of-memory termination.
- Process running, no connection: compare the expected target port with the actual listener. In a container,
127.0.0.1binding can make a service unreachable from the proxy; use0.0.0.0. - Connection works locally, fails live: inspect health check path, network rules, and whether the process survives after startup.
- Fast routes work, slow routes fail: inspect upstream timeout, request duration, and worker saturation. Move long work to a job queue instead of raising every timeout.
This local test isolates image startup and port binding. It does not test the platform's routing or secrets, so repeat the readiness request against the platform URL and compare logs from the same release.
Do not treat every 502 as a deployment bug
A shared dependency outage may cause the app to close or time out upstream connections. CPU starvation can do the same under load. If a 502 began only after traffic grew, correlate it with memory, CPU, connection pool waits, and latency rather than changing DNS records.
Once fixed, add a check that would have caught the specific failure: a clean-container startup test, a readiness probe, or a post-deploy request to a real route. The goal is to turn a one-off incident into a reproducible signal.
Read the time pattern
An immediate 502 after every deploy suggests startup or port configuration. A 502 only during a spike suggests exhausted workers, memory pressure, or upstream connection limits. A 502 only on one route suggests that route's dependency or timeout. Plot failures by release, route, and minute before changing infrastructure.
When the process exits, capture the first exception after startup. Later proxy errors are symptoms. If the logs show an out-of-memory kill, examine memory growth and limits; increasing the limit may buy time but does not explain a leak. If the logs are empty, inspect platform events for image-pull, permission, and health-check failures that happened before your process could log.
After a fix, write down a minimal reproduction: container command, required environment names, failing URL, and expected response. Turn it into a smoke test or startup check. This makes the next incident faster to diagnose and prevents the same 502 from returning under a different release.
Further reading
MDN's 502 definition describes the gateway semantics. NGINX proxy module documentation covers upstream timeouts and connection behavior.